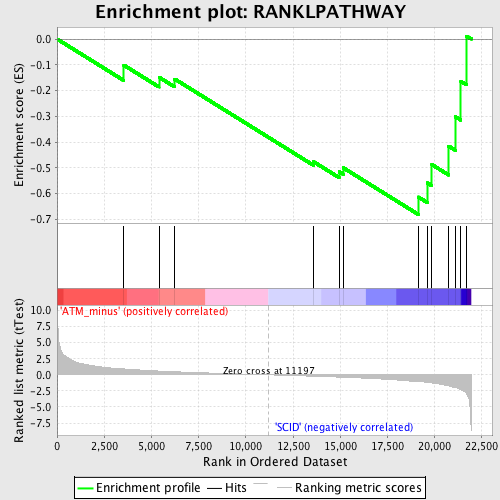
Profile of the Running ES Score & Positions of GeneSet Members on the Rank Ordered List
| Dataset | Set_01_ATM_minus_versus_SCID.phenotype_ATM_minus_versus_SCID.cls #ATM_minus_versus_SCID |
| Phenotype | phenotype_ATM_minus_versus_SCID.cls#ATM_minus_versus_SCID |
| Upregulated in class | SCID |
| GeneSet | RANKLPATHWAY |
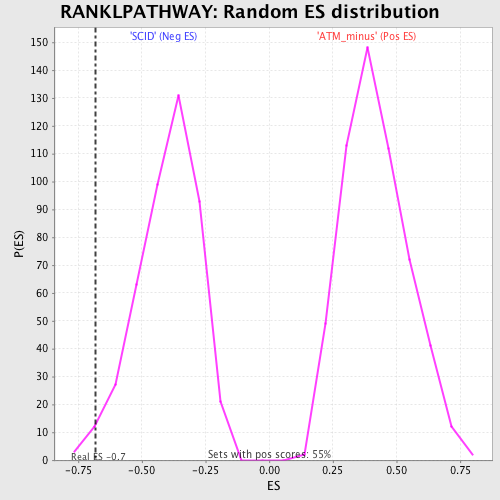
| Enrichment Score (ES) | -0.681402 |
| Normalized Enrichment Score (NES) | -1.7117331 |
| Nominal p-value | 0.020044543 |
| FDR q-value | 0.2919167 |
| FWER p-Value | 0.983 |
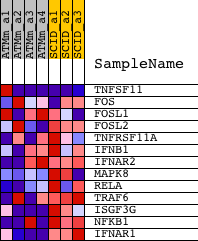
| PROBE | DESCRIPTION (from dataset) | GENE SYMBOL | GENE_TITLE | RANK IN GENE LIST | RANK METRIC SCORE | RUNNING ES | CORE ENRICHMENT | |
|---|---|---|---|---|---|---|---|---|
| 1 | TNFSF11 | 1419083_at 1451944_a_at | 3536 | 0.914 | -0.1015 | No | ||
| 2 | FOS | 1423100_at | 5397 | 0.581 | -0.1483 | No | ||
| 3 | FOSL1 | 1417487_at 1417488_at | 6230 | 0.473 | -0.1553 | No | ||
| 4 | FOSL2 | 1422931_at | 13578 | -0.215 | -0.4763 | No | ||
| 5 | TNFRSF11A | 1419214_at 1430259_at | 14937 | -0.355 | -0.5150 | No | ||
| 6 | IFNB1 | 1422305_at | 15150 | -0.380 | -0.4998 | No | ||
| 7 | IFNAR2 | 1427691_a_at 1440169_x_at 1451462_a_at | 19132 | -1.038 | -0.6135 | Yes | ||
| 8 | MAPK8 | 1420931_at 1420932_at 1437045_at 1440856_at 1457936_at | 19611 | -1.168 | -0.5588 | Yes | ||
| 9 | RELA | 1419536_a_at | 19848 | -1.253 | -0.4875 | Yes | ||
| 10 | TRAF6 | 1421376_at 1421377_at 1435350_at 1443288_at 1446940_at 1446977_at | 20741 | -1.716 | -0.4159 | Yes | ||
| 11 | ISGF3G | 1421322_a_at | 21098 | -1.992 | -0.3017 | Yes | ||
| 12 | NFKB1 | 1427705_a_at 1442949_at | 21385 | -2.296 | -0.1644 | Yes | ||
| 13 | IFNAR1 | 1442222_at 1449026_at | 21687 | -2.895 | 0.0114 | Yes |