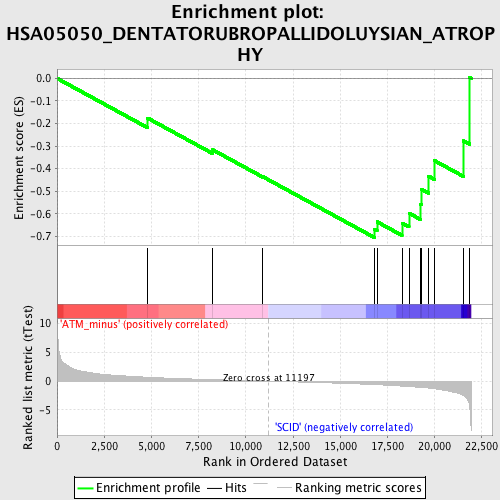
Profile of the Running ES Score & Positions of GeneSet Members on the Rank Ordered List
| Dataset | Set_01_ATM_minus_versus_SCID.phenotype_ATM_minus_versus_SCID.cls #ATM_minus_versus_SCID |
| Phenotype | phenotype_ATM_minus_versus_SCID.cls#ATM_minus_versus_SCID |
| Upregulated in class | SCID |
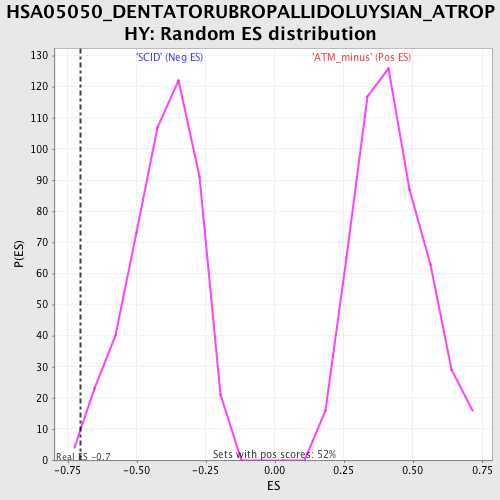
| GeneSet | HSA05050_DENTATORUBROPALLIDOLUYSIAN_ATROPHY |
| Enrichment Score (ES) | -0.7049115 |
| Normalized Enrichment Score (NES) | -1.7462991 |
| Nominal p-value | 0.008316008 |
| FDR q-value | 0.37509638 |
| FWER p-Value | 0.952 |
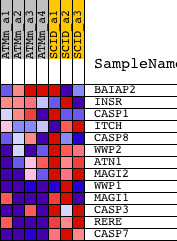
| PROBE | DESCRIPTION (from dataset) | GENE SYMBOL | GENE_TITLE | RANK IN GENE LIST | RANK METRIC SCORE | RUNNING ES | CORE ENRICHMENT | |
|---|---|---|---|---|---|---|---|---|
| 1 | BAIAP2 | 1425656_a_at 1435128_at 1451027_at 1451028_at | 4795 | 0.675 | -0.1760 | No | ||
| 2 | INSR | 1421380_at 1450225_at | 8247 | 0.262 | -0.3168 | No | ||
| 3 | CASP1 | 1449265_at | 10900 | 0.028 | -0.4360 | No | ||
| 4 | ITCH | 1415769_at 1431316_at 1459332_at | 16797 | -0.589 | -0.6676 | Yes | ||
| 5 | CASP8 | 1424552_at | 16947 | -0.612 | -0.6356 | Yes | ||
| 6 | WWP2 | 1438482_at 1442162_at 1448145_at 1448146_at 1456714_at 1457499_at | 18269 | -0.865 | -0.6410 | Yes | ||
| 7 | ATN1 | 1421149_a_at | 18639 | -0.953 | -0.5975 | Yes | ||
| 8 | MAGI2 | 1420532_at 1440807_at 1454855_at | 19260 | -1.067 | -0.5581 | Yes | ||
| 9 | WWP1 | 1427097_at 1427098_at 1446364_at 1446853_at 1452299_at | 19302 | -1.078 | -0.4916 | Yes | ||
| 10 | MAGI1 | 1427246_at 1440071_at 1440871_at 1443231_at 1445088_at 1445952_at 1446050_at 1451893_s_at 1452369_at 1457572_at 1458240_at | 19672 | -1.188 | -0.4332 | Yes | ||
| 11 | CASP3 | 1426165_a_at 1430192_at 1449839_at | 19993 | -1.310 | -0.3648 | Yes | ||
| 12 | RERE | 1454670_at | 21526 | -2.488 | -0.2770 | Yes | ||
| 13 | CASP7 | 1426062_a_at 1448659_at | 21858 | -4.665 | 0.0036 | Yes |