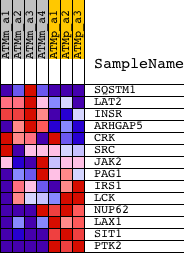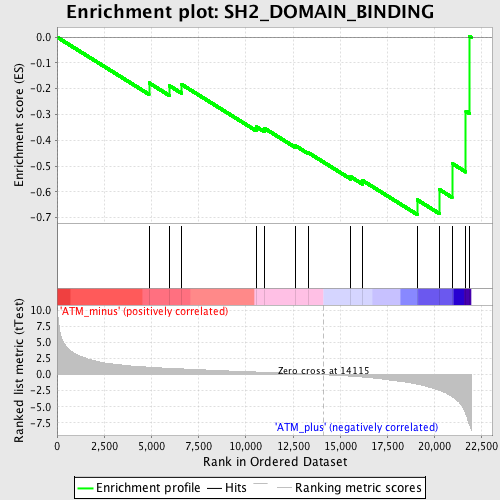
Profile of the Running ES Score & Positions of GeneSet Members on the Rank Ordered List
| Dataset | Set_01_ATM_minus_versus_ATM_plus.phenotype_ATM_minus_versus_ATM_plus.cls #ATM_minus_versus_ATM_plus.phenotype_ATM_minus_versus_ATM_plus.cls #ATM_minus_versus_ATM_plus_repos |
| Phenotype | phenotype_ATM_minus_versus_ATM_plus.cls#ATM_minus_versus_ATM_plus_repos |
| Upregulated in class | ATM_plus |
| GeneSet | SH2_DOMAIN_BINDING |
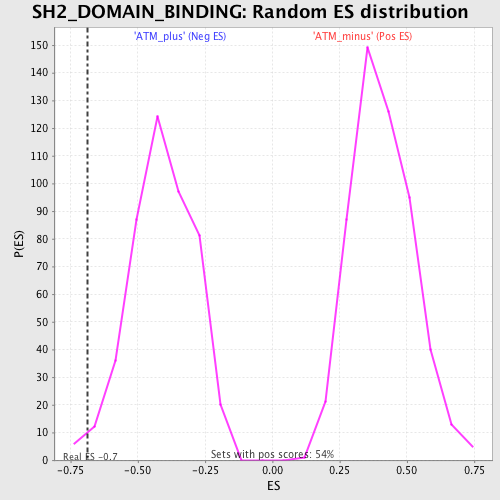
| Enrichment Score (ES) | -0.6881752 |
| Normalized Enrichment Score (NES) | -1.6822188 |
| Nominal p-value | 0.015118791 |
| FDR q-value | 0.30741152 |
| FWER p-Value | 0.989 |
| PROBE | DESCRIPTION (from dataset) | GENE SYMBOL | GENE_TITLE | RANK IN GENE LIST | RANK METRIC SCORE | RUNNING ES | CORE ENRICHMENT | |
|---|---|---|---|---|---|---|---|---|
| 1 | SQSTM1 | 1440076_at 1442237_at 1444021_at 1450957_a_at | 4868 | 1.159 | -0.1775 | No | ||
| 2 | LAT2 | 1426169_a_at | 5950 | 0.993 | -0.1885 | No | ||
| 3 | INSR | 1421380_at 1450225_at | 6601 | 0.897 | -0.1837 | No | ||
| 4 | ARHGAP5 | 1423194_at 1450896_at 1450897_at 1457410_at | 10545 | 0.414 | -0.3476 | No | ||
| 5 | CRK | 1416201_at 1425855_a_at 1436835_at 1448248_at 1460176_at | 10980 | 0.363 | -0.3534 | No | ||
| 6 | SRC | 1423240_at 1450918_s_at | 12634 | 0.185 | -0.4217 | No | ||
| 7 | JAK2 | 1421065_at 1421066_at | 13318 | 0.103 | -0.4489 | No | ||
| 8 | PAG1 | 1423002_at 1440033_at 1443319_at 1456403_at | 15557 | -0.231 | -0.5421 | No | ||
| 9 | IRS1 | 1423104_at | 16185 | -0.367 | -0.5566 | No | ||
| 10 | LCK | 1425396_a_at 1439145_at 1439146_s_at 1457917_at | 19071 | -1.481 | -0.6312 | Yes | ||
| 11 | NUP62 | 1415925_a_at 1415926_at 1437612_at 1438917_x_at 1447905_x_at 1448150_at | 20265 | -2.430 | -0.5921 | Yes | ||
| 12 | LAX1 | 1438687_at | 20919 | -3.427 | -0.4900 | Yes | ||
| 13 | SIT1 | 1418751_at | 21653 | -6.137 | -0.2872 | Yes | ||
| 14 | PTK2 | 1423059_at 1430827_a_at 1439198_at 1440082_at 1441475_at 1443384_at 1445137_at | 21846 | -7.797 | 0.0041 | Yes |