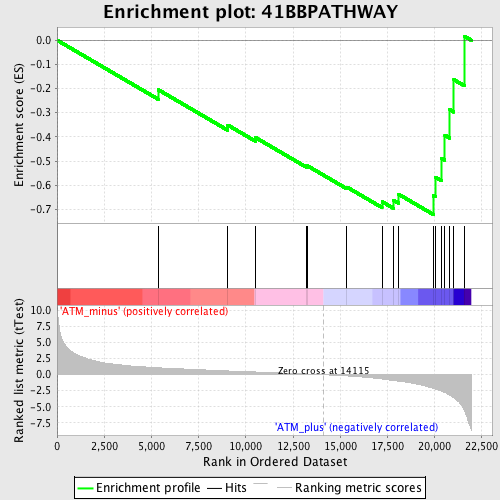
Profile of the Running ES Score & Positions of GeneSet Members on the Rank Ordered List
| Dataset | Set_01_ATM_minus_versus_ATM_plus.phenotype_ATM_minus_versus_ATM_plus.cls #ATM_minus_versus_ATM_plus.phenotype_ATM_minus_versus_ATM_plus.cls #ATM_minus_versus_ATM_plus_repos |
| Phenotype | phenotype_ATM_minus_versus_ATM_plus.cls#ATM_minus_versus_ATM_plus_repos |
| Upregulated in class | ATM_plus |
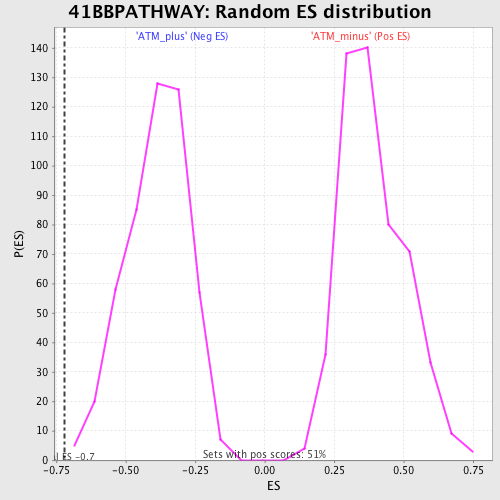
| GeneSet | 41BBPATHWAY |
| Enrichment Score (ES) | -0.72138566 |
| Normalized Enrichment Score (NES) | -1.855964 |
| Nominal p-value | 0.002057613 |
| FDR q-value | 0.04349677 |
| FWER p-Value | 0.484 |
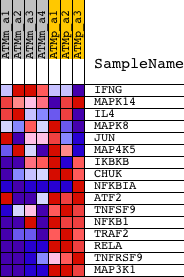
| PROBE | DESCRIPTION (from dataset) | GENE SYMBOL | GENE_TITLE | RANK IN GENE LIST | RANK METRIC SCORE | RUNNING ES | CORE ENRICHMENT | |
|---|---|---|---|---|---|---|---|---|
| 1 | IFNG | 1425947_at | 5363 | 1.070 | -0.2051 | No | ||
| 2 | MAPK14 | 1416703_at 1416704_at 1426104_at 1442364_at 1451927_a_at 1459617_at | 9038 | 0.581 | -0.3512 | No | ||
| 3 | IL4 | 1449864_at | 10496 | 0.418 | -0.4022 | No | ||
| 4 | MAPK8 | 1420931_at 1420932_at 1437045_at 1440856_at 1457936_at | 13226 | 0.116 | -0.5225 | No | ||
| 5 | JUN | 1417409_at 1448694_at | 13265 | 0.110 | -0.5201 | No | ||
| 6 | MAP4K5 | 1427083_a_at 1427084_a_at 1427376_a_at 1440059_at 1445426_at 1446348_at 1447204_at | 15348 | -0.195 | -0.6079 | No | ||
| 7 | IKBKB | 1426207_at 1426333_a_at 1432275_at 1445141_at 1454184_a_at | 17210 | -0.664 | -0.6683 | Yes | ||
| 8 | CHUK | 1417091_at 1428210_s_at 1451383_a_at | 17804 | -0.903 | -0.6620 | Yes | ||
| 9 | NFKBIA | 1420088_at 1420089_at 1438157_s_at 1448306_at 1449731_s_at | 18087 | -1.008 | -0.6376 | Yes | ||
| 10 | ATF2 | 1426582_at 1426583_at 1427559_a_at 1437777_at 1452116_s_at 1459237_at | 19925 | -2.103 | -0.6437 | Yes | ||
| 11 | TNFSF9 | 1422924_at | 20035 | -2.212 | -0.5669 | Yes | ||
| 12 | NFKB1 | 1427705_a_at 1442949_at | 20346 | -2.528 | -0.4876 | Yes | ||
| 13 | TRAF2 | 1451233_at | 20539 | -2.786 | -0.3934 | Yes | ||
| 14 | RELA | 1419536_a_at | 20799 | -3.184 | -0.2875 | Yes | ||
| 15 | TNFRSF9 | 1421481_at 1428034_a_at 1460469_at | 21014 | -3.623 | -0.1634 | Yes | ||
| 16 | MAP3K1 | 1424850_at | 21563 | -5.558 | 0.0170 | Yes |