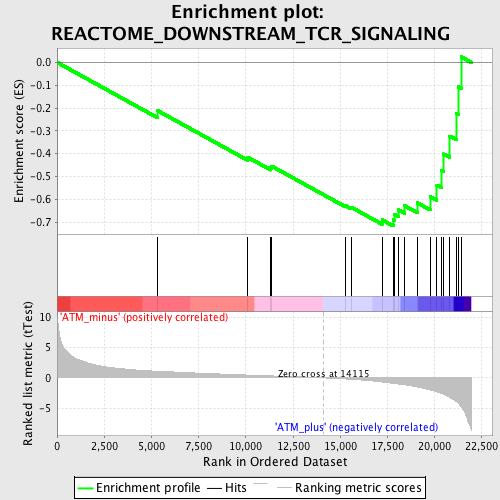
Profile of the Running ES Score & Positions of GeneSet Members on the Rank Ordered List
| Dataset | Set_01_ATM_minus_versus_ATM_plus.phenotype_ATM_minus_versus_ATM_plus.cls #ATM_minus_versus_ATM_plus.phenotype_ATM_minus_versus_ATM_plus.cls #ATM_minus_versus_ATM_plus_repos |
| Phenotype | phenotype_ATM_minus_versus_ATM_plus.cls#ATM_minus_versus_ATM_plus_repos |
| Upregulated in class | ATM_plus |
| GeneSet | REACTOME_DOWNSTREAM_TCR_SIGNALING |
| Enrichment Score (ES) | -0.71673876 |
| Normalized Enrichment Score (NES) | -1.9150051 |
| Nominal p-value | 0.0020283975 |
| FDR q-value | 0.020109493 |
| FWER p-Value | 0.145 |
| PROBE | DESCRIPTION (from dataset) | GENE SYMBOL | GENE_TITLE | RANK IN GENE LIST | RANK METRIC SCORE | RUNNING ES | CORE ENRICHMENT | |
|---|---|---|---|---|---|---|---|---|
| 1 | MAP3K7 | 1419988_at 1425795_a_at 1426627_at 1449693_at 1455441_at 1458787_at | 5318 | 1.078 | -0.2111 | No | ||
| 2 | PTEN | 1422553_at 1441593_at 1444325_at 1450655_at 1454722_at 1455728_at 1457493_at | 10105 | 0.457 | -0.4162 | No | ||
| 3 | RIPK2 | 1421236_at 1450173_at | 11319 | 0.326 | -0.4620 | No | ||
| 4 | CD3E | 1422105_at 1445748_at | 11363 | 0.321 | -0.4545 | No | ||
| 5 | PIK3R1 | 1425514_at 1425515_at 1438682_at 1444591_at 1451737_at | 15248 | -0.177 | -0.6266 | No | ||
| 6 | PIK3CB | 1445731_at 1453069_at | 15590 | -0.237 | -0.6352 | No | ||
| 7 | IKBKB | 1426207_at 1426333_a_at 1432275_at 1445141_at 1454184_a_at | 17210 | -0.664 | -0.6897 | No | ||
| 8 | CHUK | 1417091_at 1428210_s_at 1451383_a_at | 17804 | -0.903 | -0.6903 | Yes | ||
| 9 | TRAT1 | 1427532_at 1437561_at | 17860 | -0.932 | -0.6656 | Yes | ||
| 10 | NFKBIA | 1420088_at 1420089_at 1438157_s_at 1448306_at 1449731_s_at | 18087 | -1.008 | -0.6464 | Yes | ||
| 11 | UBE2N | 1422559_at 1435384_at | 18407 | -1.125 | -0.6281 | Yes | ||
| 12 | LCK | 1425396_a_at 1439145_at 1439146_s_at 1457917_at | 19071 | -1.481 | -0.6151 | Yes | ||
| 13 | BCL10 | 1418970_a_at 1418971_x_at 1418972_at 1443524_x_at | 19756 | -1.997 | -0.5879 | Yes | ||
| 14 | CD4 | 1419696_at 1427779_a_at | 20116 | -2.283 | -0.5376 | Yes | ||
| 15 | NFKB1 | 1427705_a_at 1442949_at | 20346 | -2.528 | -0.4741 | Yes | ||
| 16 | CD3D | 1422828_at | 20479 | -2.698 | -0.4013 | Yes | ||
| 17 | RELA | 1419536_a_at | 20799 | -3.184 | -0.3228 | Yes | ||
| 18 | PDPK1 | 1415729_at 1416501_at 1459775_at 1459776_x_at | 21147 | -3.899 | -0.2246 | Yes | ||
| 19 | CD3G | 1419178_at | 21259 | -4.191 | -0.1072 | Yes | ||
| 20 | PRKCQ | 1426044_a_at | 21404 | -4.723 | 0.0243 | Yes |

