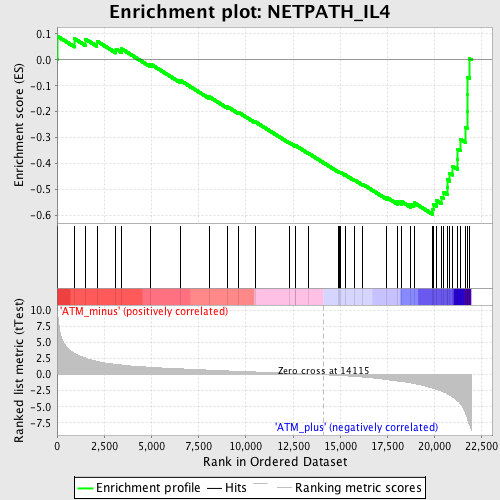
Profile of the Running ES Score & Positions of GeneSet Members on the Rank Ordered List
| Dataset | Set_01_ATM_minus_versus_ATM_plus.phenotype_ATM_minus_versus_ATM_plus.cls #ATM_minus_versus_ATM_plus.phenotype_ATM_minus_versus_ATM_plus.cls #ATM_minus_versus_ATM_plus_repos |
| Phenotype | phenotype_ATM_minus_versus_ATM_plus.cls#ATM_minus_versus_ATM_plus_repos |
| Upregulated in class | ATM_plus |
| GeneSet | NETPATH_IL4 |
| Enrichment Score (ES) | -0.5971321 |
| Normalized Enrichment Score (NES) | -1.9256598 |
| Nominal p-value | 0.0 |
| FDR q-value | 0.02015874 |
| FWER p-Value | 0.13 |
| PROBE | DESCRIPTION (from dataset) | GENE SYMBOL | GENE_TITLE | RANK IN GENE LIST | RANK METRIC SCORE | RUNNING ES | CORE ENRICHMENT | |
|---|---|---|---|---|---|---|---|---|
| 1 | PLCG1 | 1435149_at 1450360_at | 8 | 9.555 | 0.0916 | No | ||
| 2 | PIK3R2 | 1418463_at | 929 | 3.296 | 0.0813 | No | ||
| 3 | RASA1 | 1426476_at 1426477_at 1426478_at 1438998_at | 1500 | 2.593 | 0.0803 | No | ||
| 4 | SOCS3 | 1416576_at 1455899_x_at 1456212_x_at | 2112 | 2.071 | 0.0723 | No | ||
| 5 | FES | 1427368_x_at 1452410_a_at | 3117 | 1.599 | 0.0418 | No | ||
| 6 | PRKCI | 1417410_s_at 1448695_at | 3408 | 1.506 | 0.0431 | No | ||
| 7 | ELK1 | 1421896_at 1421897_at 1446390_at | 4953 | 1.143 | -0.0164 | No | ||
| 8 | PRKCZ | 1418085_at 1449692_at 1454902_at | 6548 | 0.906 | -0.0805 | No | ||
| 9 | BAD | 1416582_a_at 1416583_at | 8047 | 0.703 | -0.1422 | No | ||
| 10 | MAPK14 | 1416703_at 1416704_at 1426104_at 1442364_at 1451927_a_at 1459617_at | 9038 | 0.581 | -0.1818 | No | ||
| 11 | ADRBK2 | 1434450_s_at 1439178_at 1440801_s_at | 9620 | 0.512 | -0.2034 | No | ||
| 12 | IL4 | 1449864_at | 10496 | 0.418 | -0.2393 | No | ||
| 13 | JAK3 | 1425750_a_at 1446515_at | 12294 | 0.222 | -0.3193 | No | ||
| 14 | PTPN11 | 1421196_at 1427699_a_at 1451225_at | 12606 | 0.188 | -0.3317 | No | ||
| 15 | SRC | 1423240_at 1450918_s_at | 12634 | 0.185 | -0.3311 | No | ||
| 16 | JAK2 | 1421065_at 1421066_at | 13318 | 0.103 | -0.3613 | No | ||
| 17 | SHC1 | 1422853_at 1422854_at | 14924 | -0.125 | -0.4334 | No | ||
| 18 | PIK3CA | 1423144_at 1429434_at 1429435_x_at 1440054_at 1453134_at 1460326_at | 14972 | -0.133 | -0.4343 | No | ||
| 19 | CD40 | 1439221_s_at 1449473_s_at 1460415_a_at | 14984 | -0.135 | -0.4335 | No | ||
| 20 | PIK3R1 | 1425514_at 1425515_at 1438682_at 1444591_at 1451737_at | 15248 | -0.177 | -0.4438 | No | ||
| 21 | SOCS5 | 1423349_at 1423350_at 1441640_at 1442890_at | 15774 | -0.276 | -0.4651 | No | ||
| 22 | IRS1 | 1423104_at | 16185 | -0.367 | -0.4803 | No | ||
| 23 | GRB2 | 1418508_a_at 1449111_a_at | 17468 | -0.764 | -0.5315 | No | ||
| 24 | PRKD3 | 1420567_at 1428229_at 1428230_at 1444691_at | 18046 | -0.998 | -0.5483 | No | ||
| 25 | JAK1 | 1433803_at 1433804_at 1433805_at | 18239 | -1.056 | -0.5469 | No | ||
| 26 | SOS1 | 1421884_at 1421885_at 1421886_at | 18731 | -1.279 | -0.5570 | No | ||
| 27 | BCL2L1 | 1420887_a_at 1420888_at 1426050_at 1426191_a_at | 18903 | -1.376 | -0.5515 | No | ||
| 28 | IL4R | 1421034_a_at 1423996_a_at 1447858_x_at | 19902 | -2.092 | -0.5770 | Yes | ||
| 29 | ATF2 | 1426582_at 1426583_at 1427559_a_at 1437777_at 1452116_s_at 1459237_at | 19925 | -2.103 | -0.5577 | Yes | ||
| 30 | CXCR4 | 1448710_at | 20095 | -2.256 | -0.5437 | Yes | ||
| 31 | NFKB1 | 1427705_a_at 1442949_at | 20346 | -2.528 | -0.5308 | Yes | ||
| 32 | STAT6 | 1421708_a_at 1426353_at | 20465 | -2.672 | -0.5105 | Yes | ||
| 33 | IRS2 | 1443969_at | 20670 | -2.975 | -0.4912 | Yes | ||
| 34 | PTPN6 | 1456694_x_at 1460188_at | 20681 | -2.991 | -0.4628 | Yes | ||
| 35 | RELA | 1419536_a_at | 20799 | -3.184 | -0.4375 | Yes | ||
| 36 | EP300 | 1434765_at | 20959 | -3.504 | -0.4110 | Yes | ||
| 37 | IL2RG | 1416295_a_at 1416296_at | 21208 | -4.051 | -0.3833 | Yes | ||
| 38 | CREBBP | 1434633_at 1435224_at 1436983_at 1444856_at 1457641_at 1459804_at | 21224 | -4.102 | -0.3445 | Yes | ||
| 39 | DOK2 | 1416333_at | 21367 | -4.624 | -0.3065 | Yes | ||
| 40 | SOCS1 | 1440047_at 1450446_a_at | 21625 | -5.963 | -0.2608 | Yes | ||
| 41 | STAT1 | 1420915_at 1440481_at 1450033_a_at 1450034_at | 21734 | -6.804 | -0.2002 | Yes | ||
| 42 | PRKCD | 1422847_a_at 1442256_at | 21741 | -6.917 | -0.1339 | Yes | ||
| 43 | ETS1 | 1422027_a_at 1422028_a_at 1426725_s_at 1452163_at | 21749 | -7.027 | -0.0666 | Yes | ||
| 44 | PTK2 | 1423059_at 1430827_a_at 1439198_at 1440082_at 1441475_at 1443384_at 1445137_at | 21846 | -7.797 | 0.0041 | Yes |

